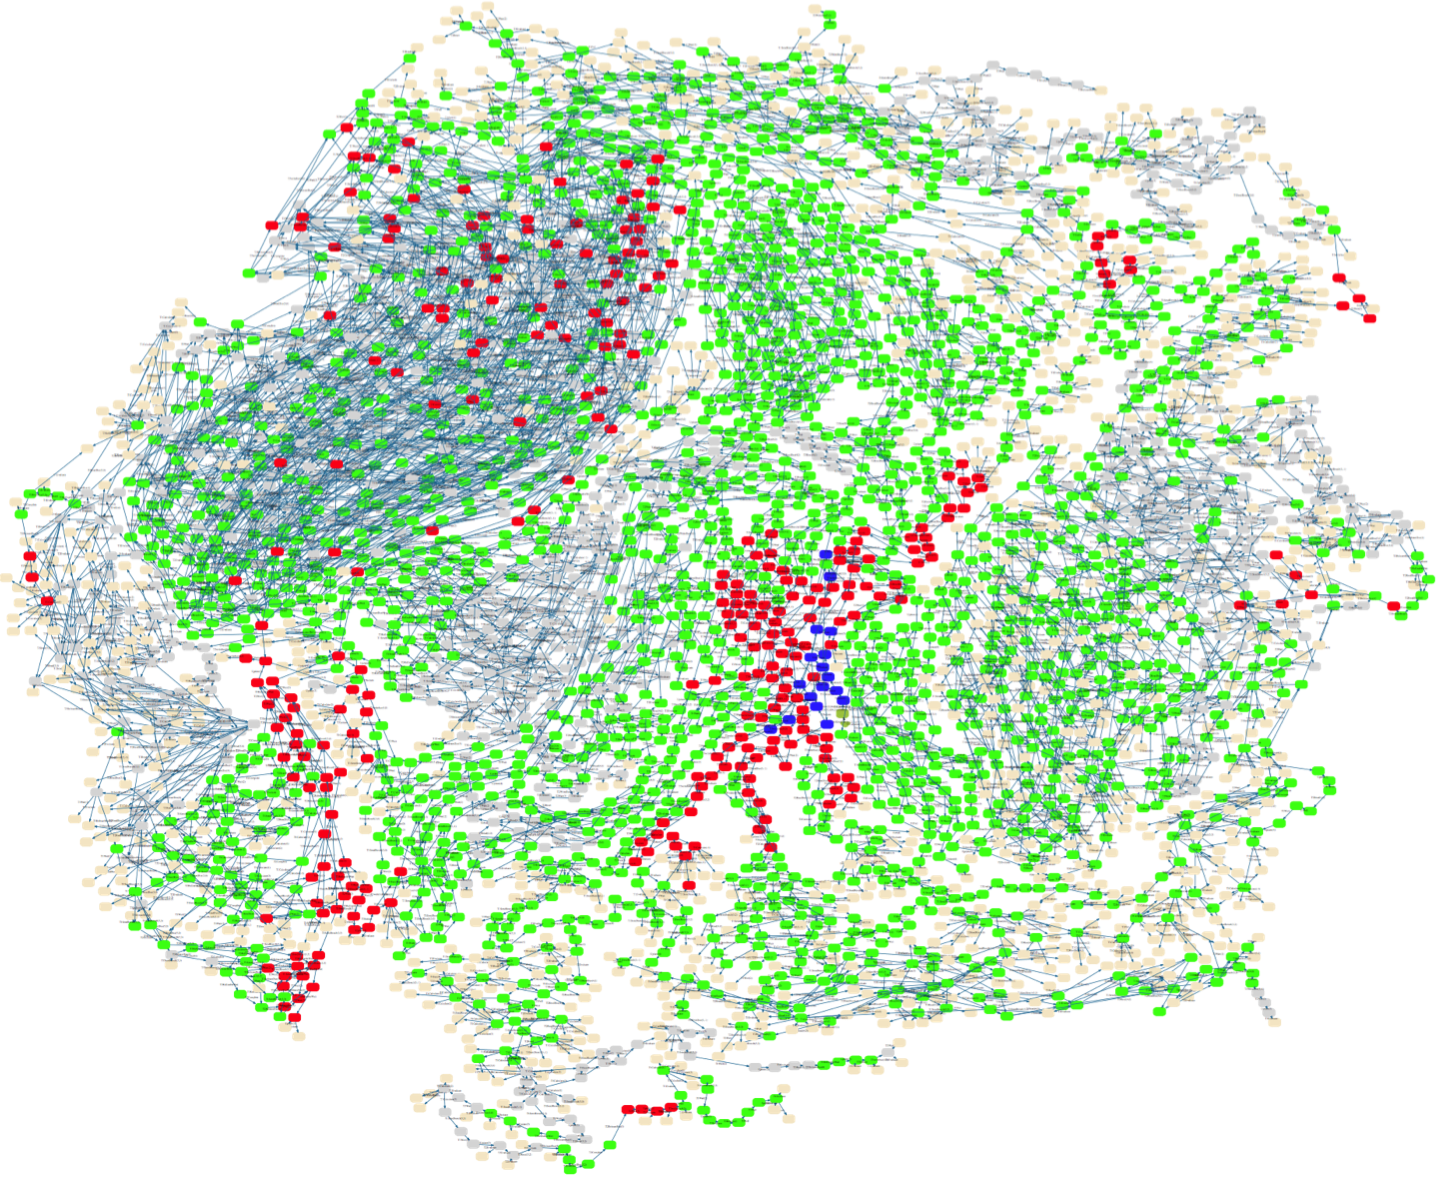
State space visualization examples
(This page is under construction)
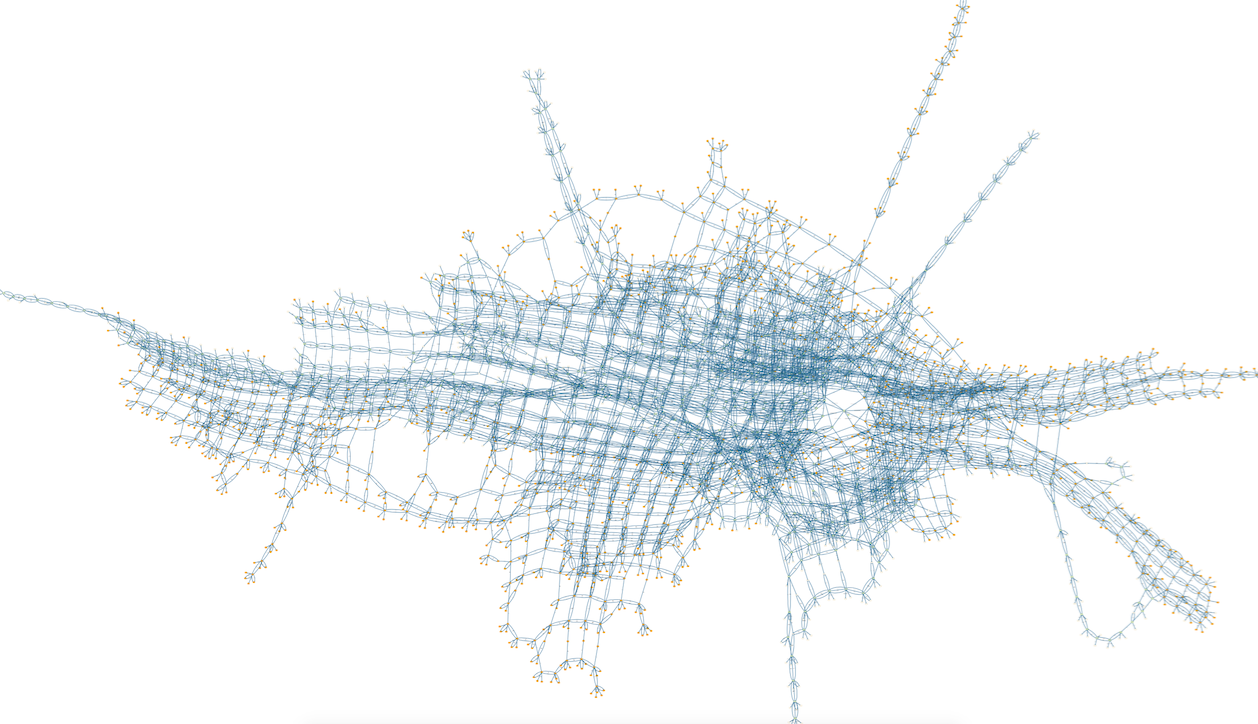
Alternating Bit Protocol
This is a visualisation of 3643 states and 11115 transitions of a TLA+ model of the alternating bit protocol, as distributed with the TLA+ tools. This model (MCAlternatingBit.tla) was loaded with ProB for TLA+, the model checker run for a few seconds and then the command "State Space Fast Rendering" with options (scale,fast) was used.
The goal predicate rBit=1 was used; those states satisfying this predicate are shown in orange.
Below is a projection of this state space onto the expression (rBit,sBit), using the "Custom Transition Diagram" feature of ProB:
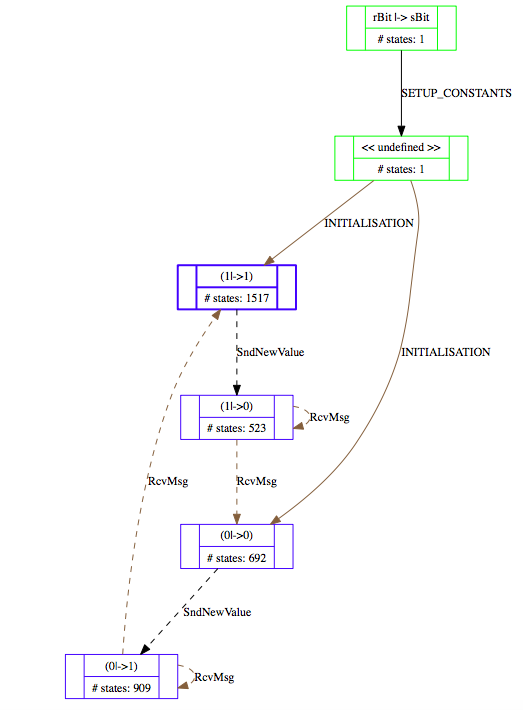
More details about this statespace projection feature can be found in our ICFEM'15 article.
The main file of the model is:
--------------------------- MODULE MCAlternatingBit -------------------------
EXTENDS AlternatingBit, TLC

INSTANCE ABCorrectness

CONSTANTS msgQLen, ackQLen

SeqConstraint == /\ Len(msgQ) \leq msgQLen
                 /\ Len(ackQ) \leq ackQLen

SentLeadsToRcvd == \A d \in Data : (sent = d) /\ (sBit # sAck) ~> (rcvd = d)
=============================================================================

ImpliedAction == [ABCNext]_cvars

TNext == WF_msgQ(~ABTypeInv')
TProp == \A d \in Data : (sent = d) => [](sent = d)

CSpec == ABSpec /\ TNext

DataPerm == Permutations(Data)
==============================================================
MCInnerFIFO
This is a visualisation of 3866 states and 9661 transitions of a TLA+ model of a FIFO, as distributed with the TLA+ tools. This model (MCInnerFIFO) was loaded with ProB for TLA+ and the model checker run so that all states with queue size greater than qLen (3) were ignored, i.e., no successor states were computed (this can be set by defining SCOPE==card(q)<=qLen). The colour indicates the length of the queue variable q of the model (gray=0,blue=1,red=2, green=3, lightgray=4) .
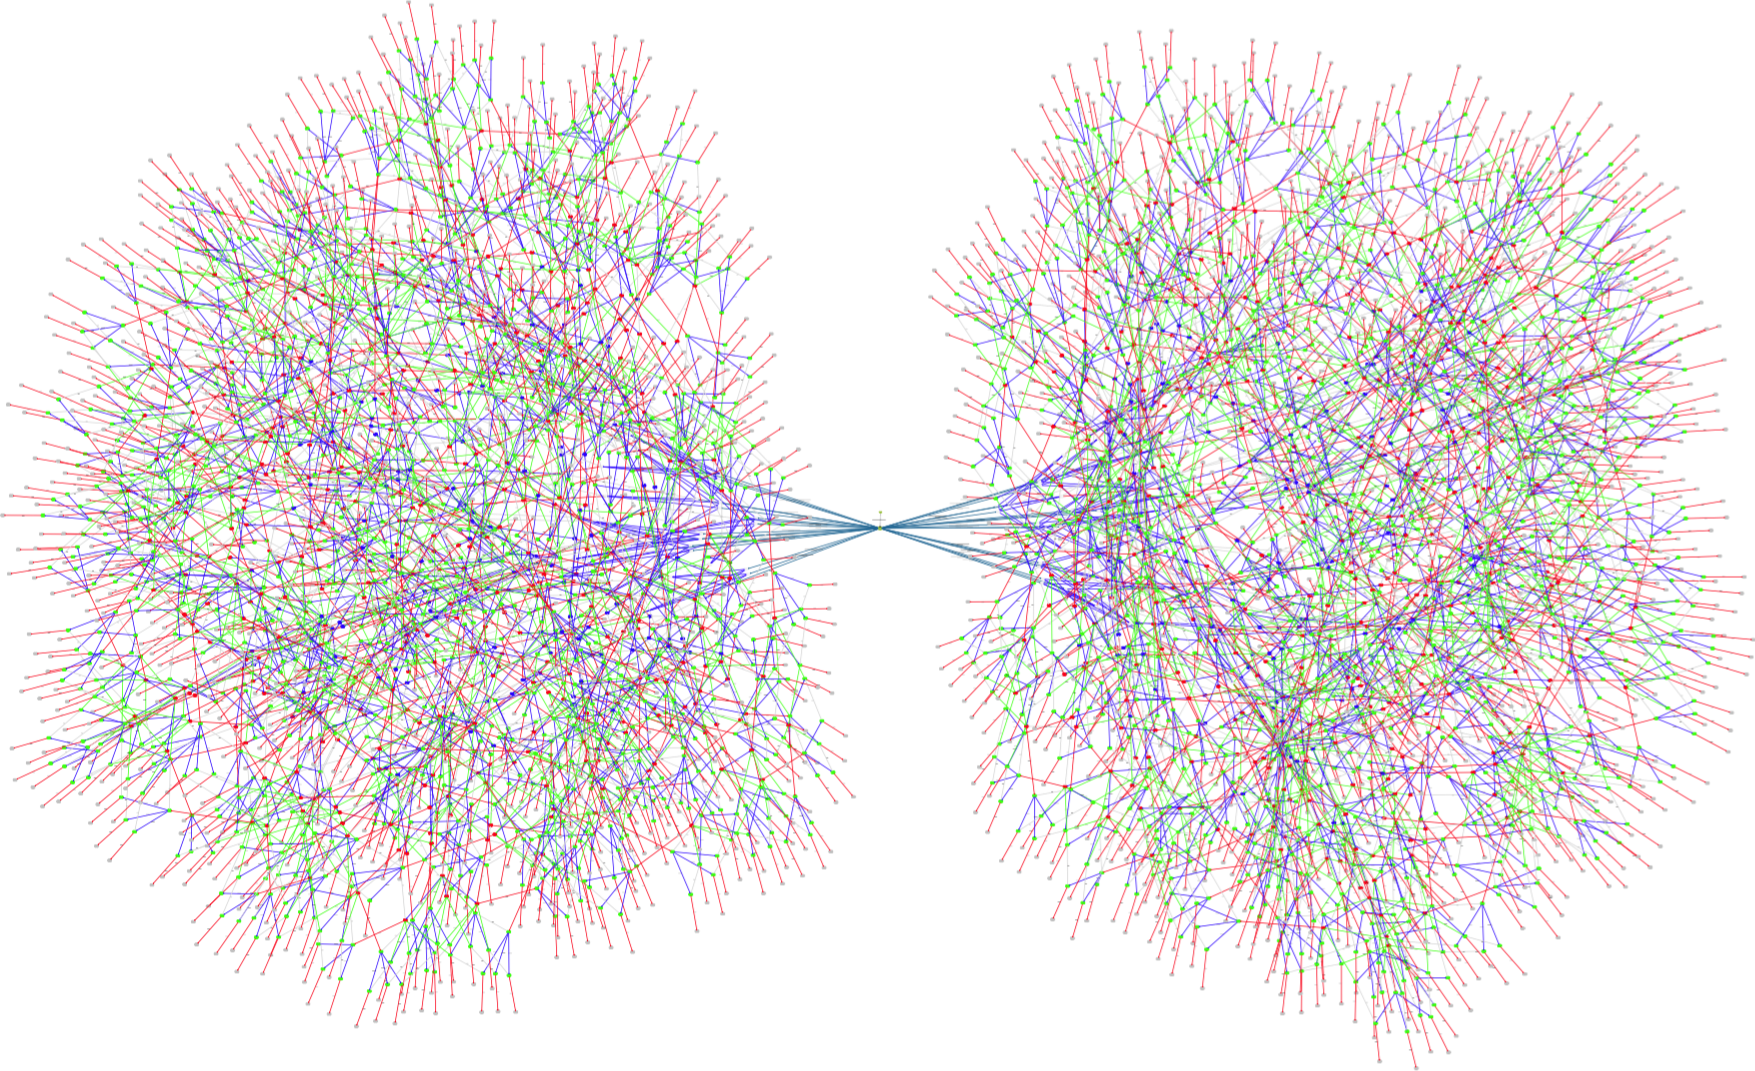
Below is a projection of this state space onto the expression card(q), using the "Custom Transition Diagram" feature of ProB:

RushHour
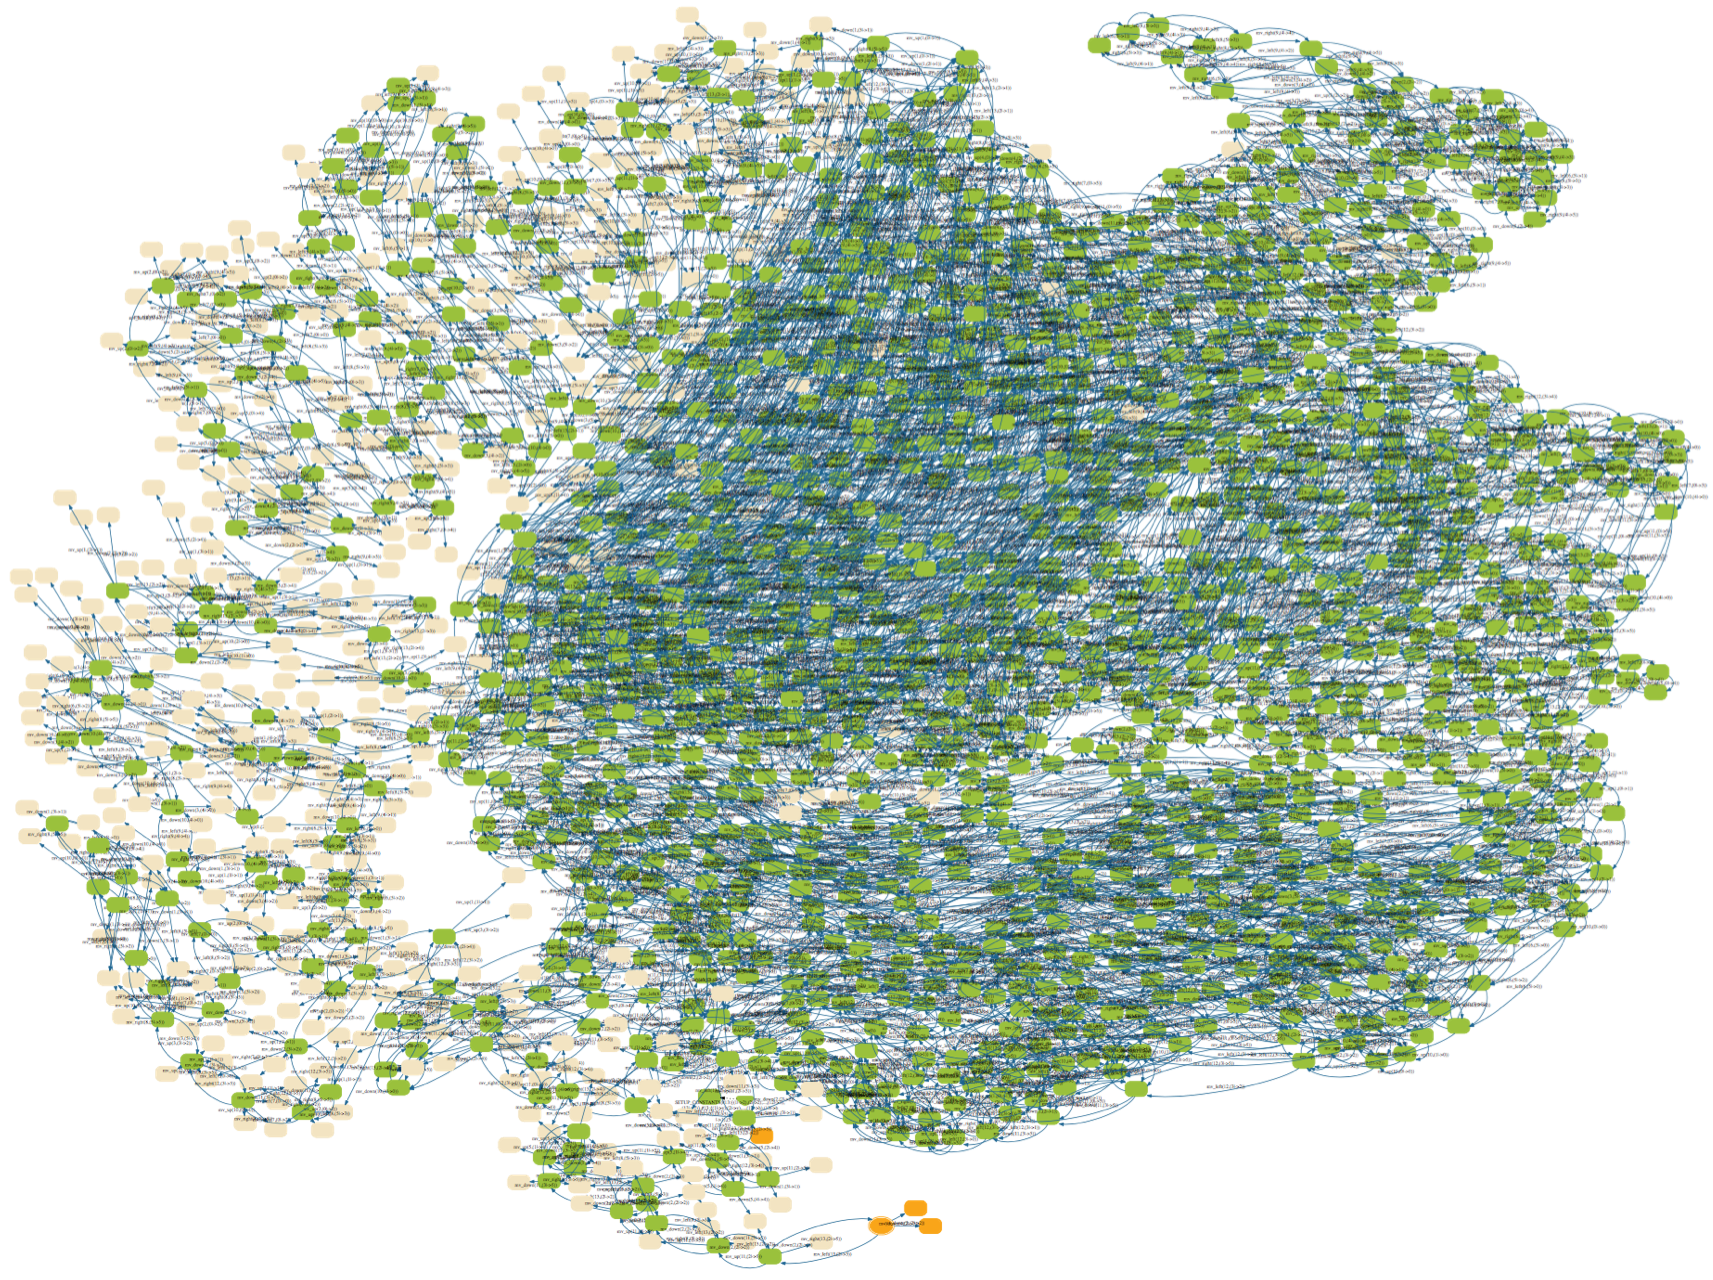
This is a visualisation of the Rush_Hour_Puzzle Rush Hour puzzle B model, at the moment that ProB has found a solution. The solution node(s) are marked in orange.
CAN Bus
This is a visualisation of the statespace of an Event-B model of a CAN Bus. The colours indicate the size of the BUSwrite variable (gray=0,blue=1,red=2, green=3, lightgray=4).
