Windows Installation Instructions
Windows Specific Download Instructions
Go to the ProB Downloads site
- Go to the page http://www.stups.uni-duesseldorf.de/ProB/index.php5/Download, this should look as follows:

Install Tcl/Tk 8.5
If Tcl/Tk 8.5 is already installed you can skip this step. Note: you need to install the 32-bit version of Tcl/Tk, even on 64-bit systems.
- Click on the "Tcl/Tk 8.5 for Windows," link provided in the "Dependencies" column and the "Windows" row above
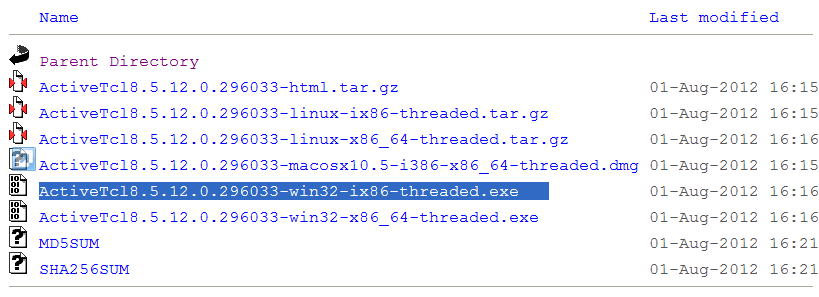
- Choose the most recent Tcl/Tk 8.5 distribution available for windows; be sure to choose a 32-bit version (the file highlighted in blue below)
- Download and follow the installation instructions

Install Java
If Java 5 or newer is already installed you can skip this step.
- Click on the "Java Runtime Environment (5.0 or newer)" link provided in the "Dependencies" column and the "Windows" row above
- Follow the installation instructions
Download the ProB for Windows Zipfile
- Click on the "Zipfile (with probcli)" link in the Download column and Windows row
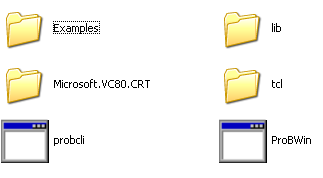
- Decompress and expand the ProB directory if necessary. Do not change the location and structure of the files and directories within ProB (apart from the Machines directory)! The contents of the ProB directory should look something like this:

The subfolder called "Microsoft.VC80.CRT" contains the DLLs for the Microsoft C runtime.
Optionally Download GraphViz
- Install the "dot" program and "dotty" viewer from AT&T's Graphviz package (http://www.graphviz.org/ or http://www.research.att.com/sw/tools/graphviz/)
Start ProB
- Start ProB by double-clicking on the ProBWin icon above
- Try to open some of the examples provided in the Examples folder shown above
- Contact us if you have problems
Checklist/Troubleshooting
- Java: be sure to have Java 1.5 or newer installed. Otherwise you will not be able to parse your own classical B machines as our parser is written in Java.
- Tcl/Tk: be sure to have a 32-bit version of TclTk 8.5 installed
- Try starting ProBWin or probcli from the Windows Command Prompt; the error messages may help you or us uncover the problem
- In case you cannot start neither ProBWin nor probcli, you may want and try to install the Microsoft C runtime for yourself (rather than rely on the ones we provide in the "Microsoft.VC80.CRT" folder mentioned above.
- You can also try and obtain information from the main Windows Event/Error Log, by following these steps:
- Click Start, and then click Control Panel.
- Click Performance and Maintenance, then click Administrative Tools, and then double-click Computer Management. Or, open the MMC containing the Event Viewer snap-in.
- In the console tree, expand Event Viewer, and then click the log that contains the event that you want to view.
- In the details pane, double-click the event that you want to view.
- The Event Properties dialog box containing header information and a description of the event is displayed.