Nine Prisoners
An article in Quanta magazine mentions the following puzzle by Dudeney and popularized by Martin Gardner:
"So in the spirit of Kirkman, we will leave the gentle reader with another brainteaser, a slight variation on the schoolgirl puzzle devised in 1917 by the British puzzle aficionado Henry Ernest Dudeney and later popularized by Martin Gardner: Nine prisoners are taken outdoors for exercise in rows of three, with each adjacent pair of prisoners linked by handcuffs, on each of the six weekdays (back in Dudeney’s less enlightened times, Saturday was still a weekday). Can the prisoners be arranged over the course of the six days so that each pair of prisoners shares handcuffs exactly once?"
Here is the specification
MACHINE NinePrisoners
DEFINITIONS
 Prisoners == 1..9;
 Days == 6;
 Cuffs == {1,2,  4,5, 7,8 };
 share(day,cuff) == {arrange(day)(cuff),arrange(day)(cuff+1)}
CONSTANTS arrange
PROPERTIES
 /* typing + permutation requirement */
  arrange : (1..Days) --> perm(Prisoners) &

 /* symmetry breaking */
  arrange(1) = %i.(i:Prisoners|i) &
  !d.(d:1..Days =>
       !c.(c:Prisoners & c mod 3 = 1 => arrange(d)(c) < arrange(d)(c+2))) &
  !d.(d:1..Days =>
       !c.(c:{1,3} => arrange(d)(c) < arrange(d)(c+3)))
 &

/* the constraint proper */
  !(c,d).(c:Cuffs & d:2..Days =>
     !(c1,d1).(d1<d & d1>0 & c1:Cuffs =>
          share(d,c) /= share(d1,c1))
      )
END
The solving time using ProB on a MacBook Air is as follows: for Days == 4: 0.08 seconds, for Days==5: 0.20 seconds, for Days == 6: 80 seconds (i.e., the complete puzzle).
Simple Graphical Visualization
To generate a simple graphical visualization of the solutions found by ProB, one needs to add a definition for the animation function, e.g., as follows:
 ANIMATION_FUNCTION ==
  {r,c,i| r:1..Days & c:1..3 & i = arrange(r)(c) } \/
  {r,c,i| r:1..Days & c:5..7 & i = arrange(r)(c-1) } \/
  {r,c,i| r:1..Days & c:9..11 & i = arrange(r)(c-2) };
 ANIMATION_FUNCTION_DEFAULT == {r,c,i| r:1..Days & c:1..11 & i = "  " }
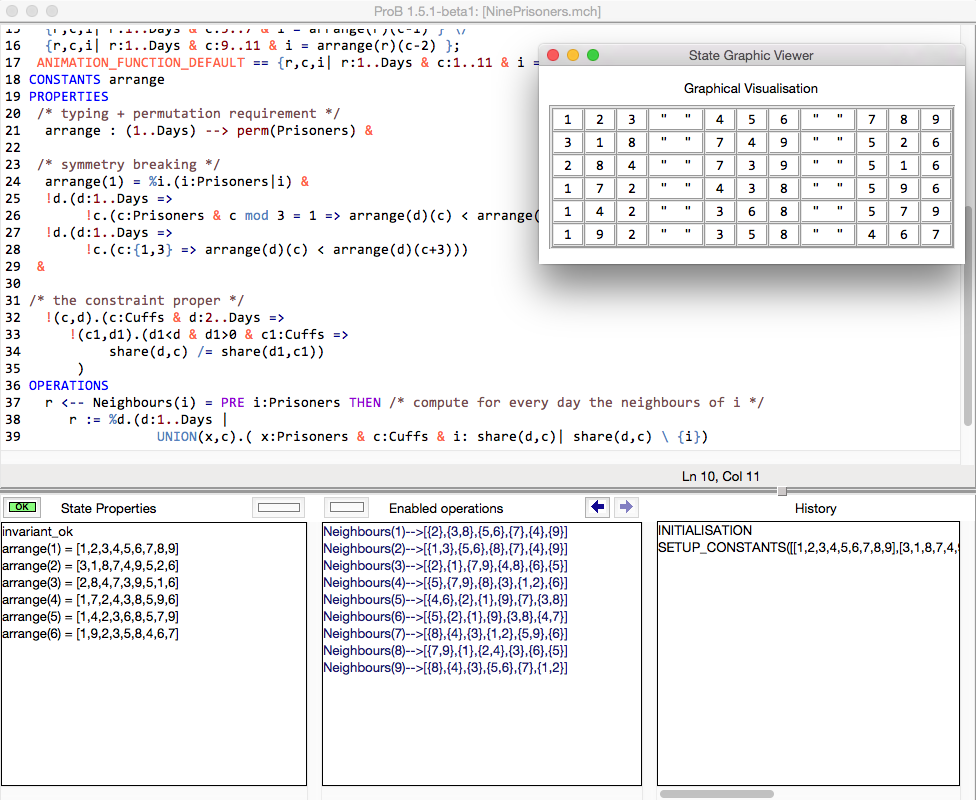
This gives rise to the following visualisation:

As can be seen in the screenshot, we have also added an operation to inspect the solution computed by ProB:
OPERATIONS
  r <-- Neighbours(i) = PRE i:Prisoners THEN /* compute for every day the neighbours of i */
     r := %d.(d:1..Days |
                UNION(x,c).( x:Prisoners & c:Cuffs & i: share(d,c)| share(d,c) \ {i})
              ) END
Adding graphical visualization
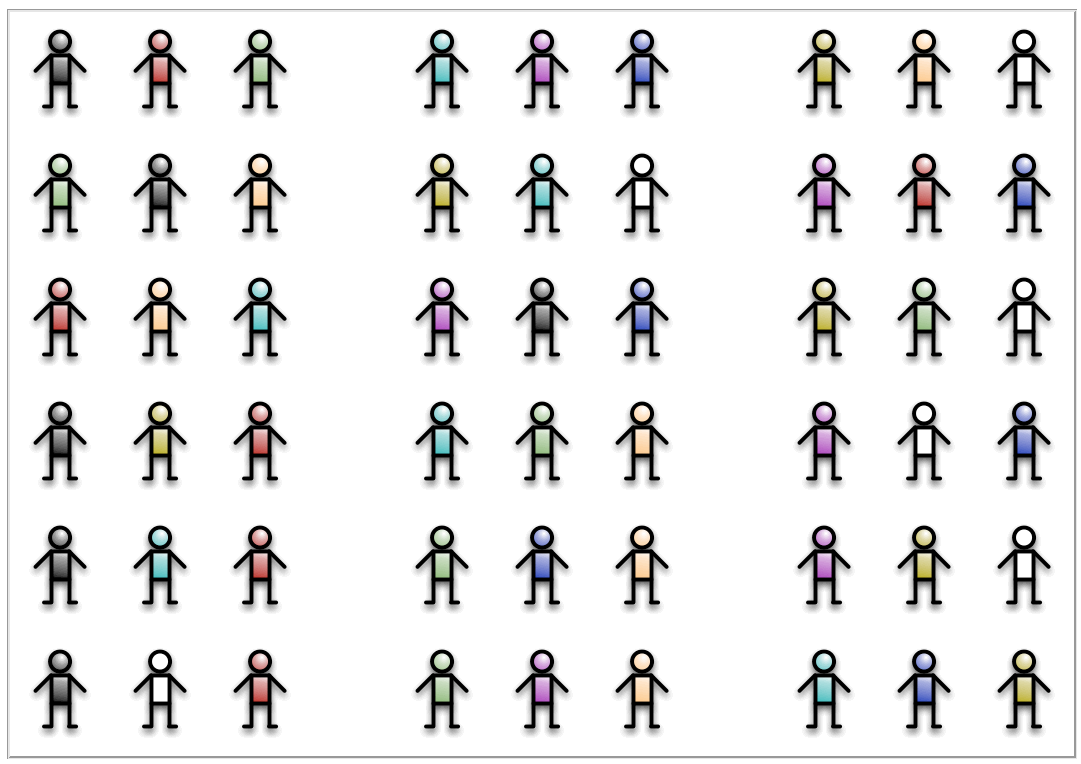
To add a better graphical visualization one needs to generate 10 pictures (in GIF format). I generate these using OmniGraffle. In the DEFINITIONS section of the B machine above, you then simply have to add the following (and remove the definition of ANIMATION_FUNCTION_DEFAULT from above):
 ANIMATION_FUNCTION_DEFAULT == {r,c,i| r:1..Days & c:1..11 & i = 0 };
 ANIMATION_IMG0 == "images/Prisoner_0.gif";
 ANIMATION_IMG1 == "images/Prisoner_1.gif";
 ANIMATION_IMG2 == "images/Prisoner_2.gif";
 ANIMATION_IMG3 == "images/Prisoner_3.gif";
 ANIMATION_IMG4 == "images/Prisoner_4.gif";
 ANIMATION_IMG5 == "images/Prisoner_5.gif";
 ANIMATION_IMG6 == "images/Prisoner_6.gif";
 ANIMATION_IMG7 == "images/Prisoner_7.gif";
 ANIMATION_IMG8 == "images/Prisoner_8.gif";
 ANIMATION_IMG9 == "images/Prisoner_9.gif"
Details about the use of this feature can be found in the Graphical_Visualization page of the manual. With the above, ProB will display the variables x, y and dist in a graphical way, and by animation one can gain insights into why it is impossible not to generate four quartets.
