Tutorial First Model Checking: Difference between revisions
| Line 55: | Line 55: | ||
[[file:ProB_GraphicalViewerPreferences_Shapes.png|center]] | [[file:ProB_GraphicalViewerPreferences_Shapes.png|center]] | ||
You can obtain more information about the state space visualisation in the user manual: [[State Space Visualization]]. | |||
Revision as of 15:14, 18 January 2010
We assume that you have loaded the "Lift.mch" B machine from the ProB Examples folder, as outlined in [[Tutorial First Steps]. There we have also seen how to execute operations on a B machine by double clicking on the items in the "Enabled Operations" pane.
Simple Model Checking
The model checker can be used to systematically execute the operations and tries to find an erroneous state (e.g., where the invariant is violated). Select the "Model Check..." command in the "Verify" menu:
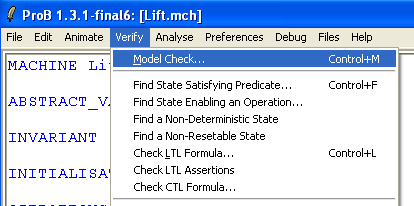
This brings up the following dialog box:
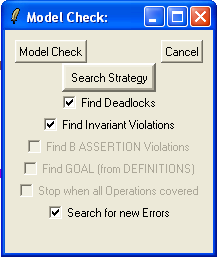
Now click the "Model Check" button. After a short while, ProB will give you the following error message:
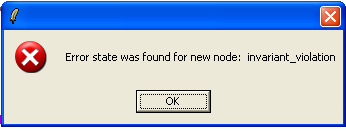
The lower half of the ProB window should now look as follows:

The red "KO" button in the "State Properties" pane tells us that the model checker has moved us into a state where the invariant is violated. Indeed, the floor variable has taken up a negative value, while the invariant requires floor to be between 0 and 99. The "History" pane tells us the sequence of operations that has led to this error. (Note that this sequence is not necessarily the shortest sequence that leads to an error or to this error. However, by selecting "Breadth First" in the model check dialog above, one can ensure that the shortest paths are found.)
Coverage Statistics
We can obtain some statistics about how many states ProB has explored by selecting the "Compute Coverage" command in the "Analyse" menu:
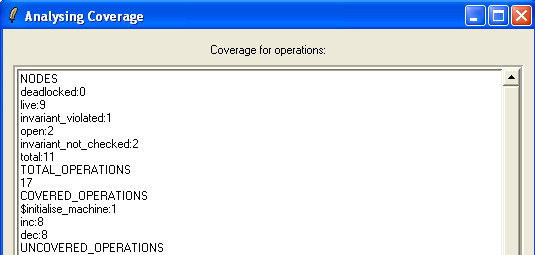
In the NODES section we can see that ProB has explored a total of 11 nodes (i.e., states of the B machine).
None of these nodes are deadlocked, in the sense that no operations are applicable.
We can also see that for one node the invariant is violated.
Of these 11 nodes, 2 are open, meaning that they have not been explored in the sense that:
- the invariant has not been evaluated
- the enabled operations have not been computed.
As such, an open node may contain an invariant violation and/or could be a deadlocking node. A live node, is a node which is not deadlocked and not open.
We can also see, that all in all there are 17 transitions among these 11 nodes. A transition is either an operation or an initialisation (there can be one more transition, which we will examine later in the tutorial).
In the COVERED_OPERATIONS section, we can see more details about these transitions: we have one initialisation, 8 inc operations and 8 dec operations.
View Statespace
We can obtain a graphical visualization of the state space explored by ProB. For this, be sure that you have correctly installed and setup the graphical viewer as desribed in the user manual. Now, choose the "View Statespace" command in the "Animate" menu:
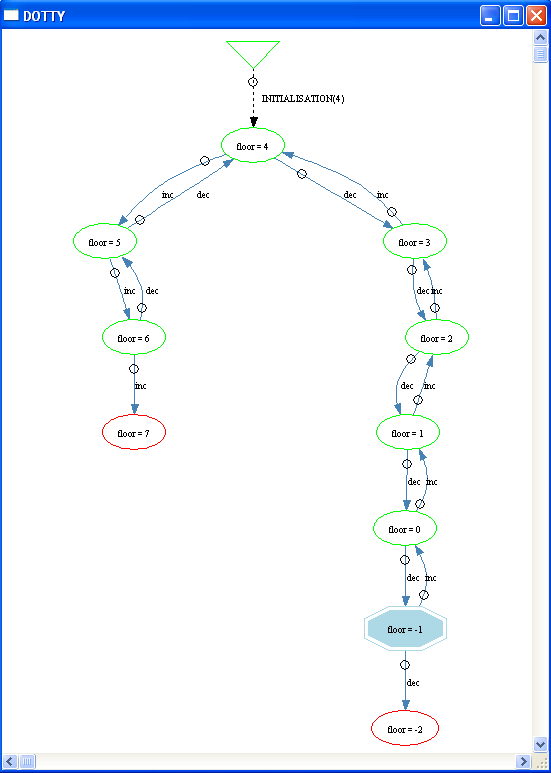
We can now see the 11 nodes. The two open nodes are marked in red. You can also see that there is a virtual root node (the inverted triangle at the top), representing the "state" of the machine before initialisation. The current node is depicted by the blue hexagon in the right hand corner.
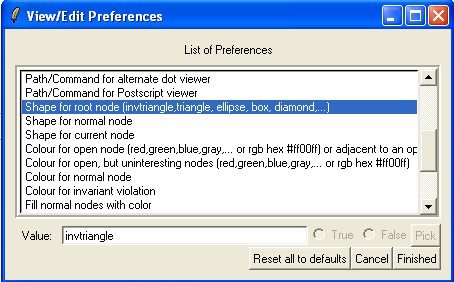
Note: you can influence the colouring and shapes used by ProB, by selecting "Graphical Viewer Preferences..." in the "Preferences" menu.
You can obtain more information about the state space visualisation in the user manual: State Space Visualization.