State Space Visualization: Difference between revisions
| Line 30: | Line 30: | ||
The two last commands of the View submenu display subgraphs of the state space. The | The two last commands of the View submenu display subgraphs of the state space. The | ||
command Subgraph for Invariant Violation displays the subgraph of nodes which violate the invariant, while the command Subgraph of nodes satisfying GOAL displays the subgraph where goals (discussed in [[Temporal Model Checking#SpecifyingGoalsandAssertions]) are satisfied. | command Subgraph for Invariant Violation displays the subgraph of nodes which violate the invariant, while the command Subgraph of nodes satisfying GOAL displays the subgraph where goals (discussed in [[Temporal Model Checking#SpecifyingGoalsandAssertions]]) are satisfied. | ||
== Preferences of the Visualisation == | == Preferences of the Visualisation == | ||
Revision as of 13:55, 18 January 2010
ProB provides several user-friendly visualisation features to help the user to analyse and understand the behaviour of his B specification. This feedback is very beneficial to the understanding of the B specification since human perception is good at identifying structural similarities and symmetries. For more information on this particular topic, the reader can refer to [1].
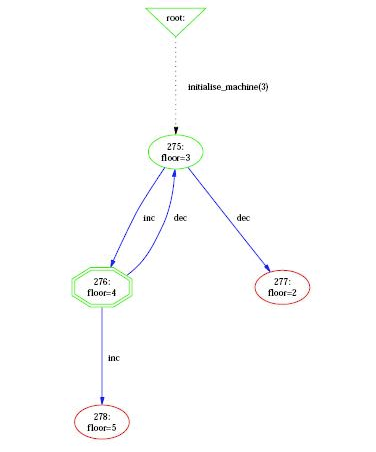
The visualisation features are in the Animate menu, and comprise the command View Visited States and all the commands of the submenu View. It is important to understand that those commands operate on the state space computed by ProB at the current point during the animation. Each time the user animates the B specification, the state space computed by ProB can be expanded if the selected operations lead to states not already computed by ProB. The command View Visited States displays in a separate window a diagram corresponding to the state space currently explored by the animation, as shown in the following Figure.
Graph Nodes
ProB displays the state space as a graph whose nodes correspond to states that are differentiated by their shapes and colors, and arcs correspond to operations. The operations are all those that are displayed in the Enabled Operations pane except backtrack, which is only useful for animation. Four types of nodes are visualised in ProB:
- root Point before the B machine is initialised, when it has no state;
- current The current state during the animation;
- normal The states that have been already computed during the animation;
- open The states that are reachable from the normal states by an enabled operation.
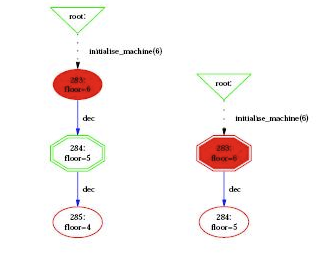
In addition to its type, a node can indicate that it corresponds to an invariant violation, displayed by a color filling as is shown on the following Figure
Other Visualisation Commands
The menu View Visited States|View contains several other commands that provide useful views on the state space. The command Shortest Trace to Current State displays the shortest sequence of nodes in the state space starting from the root node and leading to the current node. The command Current State displays the current node and its successor nodes.
The three next commands in the menu View Visited States|View provide a means to display a simplified version of the state space. A more detailed explanation is given in [1].
The command Reduced Visited States displays a state space where nodes sharing the same output arcs are collapsed into one node. The command Reducted Deterministic Automaton of Visited States removes the non-determinacy of the state space graph. The command Select Operations & Arguments for Reduction is used to specify which operations and arguments are affected by the previous transformations.
The two last commands of the View submenu display subgraphs of the state space. The command Subgraph for Invariant Violation displays the subgraph of nodes which violate the invariant, while the command Subgraph of nodes satisfying GOAL displays the subgraph where goals (discussed in Temporal Model Checking#SpecifyingGoalsandAssertions) are satisfied.
Preferences of the Visualisation
Many aspects of the visualisation can be configured in the Graphical Viewer Preferences... preference window of the Preferences menu. This includes changing the shapes and colors of the various nodes (using the notation of the dot tool, see Dot-Shapes and Dot-Colors). For selecting the colors, a color picker is available via the button Pick. The user can also select which labels to display on the nodes (value of variables) and arcs (operation arguments and return value of functions), and their font size.
The default graph viewer in ProB is dotty, from the Graphviz package. ProB enables the user to display the graph using a !PostScript viewer by setting to true the preference Use !Postscript Viewer in the Graphical Viewer Preferences.... The !PostScript file is generated by the dot tool. The path to the !PostScript viewer can be set in the Path/Command for !Postscript Viewer preference. The Pick button can be used to select the path. WARNING: All paths to files and folders should use the / character to separate the folders and should be absolute.
Using a postscript viewer rather than dotty has several advantages and several drawbacks. Firstly, the assignment of node shapes and colours is more accurately realised by dot (and therefore !PostScript). Dotty on the other hand is much easier to use when state spaces are large, notably thanks to the birdseye view. A !PostScript viewer also has the advantage that the !PostScript file may be used to capture visualisations for publication purposes.
At present, the distinction between using a !PostScript viewer as opposed to dotty comes down to the difference in functionality between the !GraphViz utilities dot and dotty. The main differences with respect to visualisation in ProB are are:
- For Postscript: Support for more visualisation shapes (for example, the shape doubleoctagon appears as a box on dotty);
- Against !PostScript: dot does not support the addition of shapes to arcs. With moderately large graphs, Dot may put nodes outside of the printable or viewable area. Examining large graphs in a !PostScript viewer may be slow (it may be awkward using pan and zoom). Support for less information on arcs (for example, dotted lines).
- For Dotty: Graphs can be modified. Dotty includes a birdseye viewer which is useful for examining large graphs.
- Against Dotty: Dotty may crash if the graph is too big or complex (and on Solaris and Linux, if non-standard mouse buttons are used).
References
- ↑ 1.0 1.1 M. Leuschel and E.Turner: Visualising larger state spaces in ProB. In H. Treharne, S. King, M. Henson, and S. Schneider, editors, ZB 2005: Formal Specification and Development in Z and B, LNCS 3455. Springer-Verlag, 2005 http://www.stups.uni-duesseldorf.de/publications/prob_visualise.pdf[wiki:Visualisation#VisualizeStateSpace

