Tutorial CSP First Step: Difference between revisions
| Line 76: | Line 76: | ||
The state space visualization features of ProB are also available for CSP; see [[State_Space_Visualization|the corresponding part of the tutorial]]. | The state space visualization features of ProB are also available for CSP; see [[State_Space_Visualization|the corresponding part of the tutorial]]. | ||
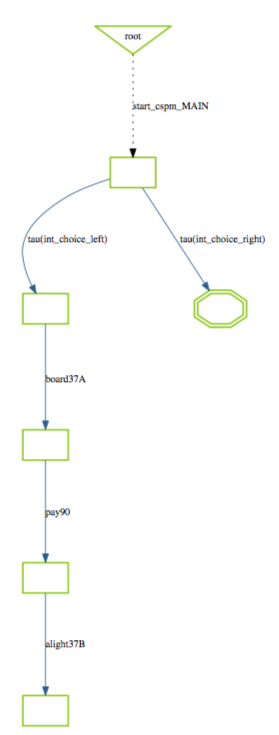
For example, if you select the command "Statespace" in the "Visualize" menu (after having fully explored the system), the following graph will be displayed: | For example, if you select the command "Statespace" in the "Visualize" menu (after having fully explored the system), the following graph will be displayed: | ||
[[file:ProB_CSPBusStatespace.png|center|| | [[file:ProB_CSPBusStatespace.png|center||200px]] | ||
Revision as of 15:29, 10 August 2015
[Category:User Manual]
Startup
Start off by installing the standalone Tcl/Tk version of ProB. Follow the instructions in Installation. Start ProB by double-clicking on ProBWin (for Windows users), or by launching StartProB.sh from a Terminal (for Linux and Mac users).
Loading a first CSP specification
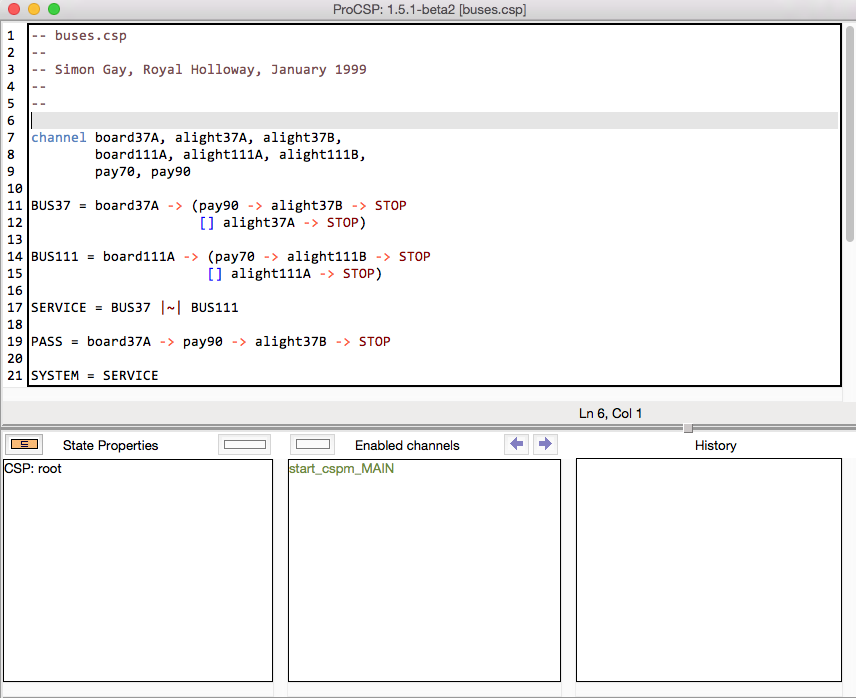
Use the "Open..." command in the "File" menu and then navigate to the "Examples" directory that came with your ProB installation. Inside the "CSP" subfolder, open the "buses.csp" specification. Your main ProB window should now look as follows:
First Steps in Animation
We have now loaded a first simple CSP model. Let us look at the contents of the ProB window (ignoring the menu bar).
- The upper half of the ProB window contains the source code of the CSP specification.
- The lower half contains three panes.
- The "State Properties" pane contains information about the current state of the specification. We will explain the contents of this pane in more detail later.
- The Pane called "Enabled Operations" contains a list of events that your CSP specification offers. At the very first step you have to choose a process to animate. If your CSP specification contains a MAIN process (as is the case in buses.csp), only this process will be shown.
- The "History" pane contains the list of operations you have executed to reach the current state of the animator. Obviously, this list is initially empty.
Now, double click on "MAIN" process in the "Enabled Operations" Pane. This has the effect of computing the events offered by MAIN. The ProB window should now look as follows (the upper half will remain unchanged):
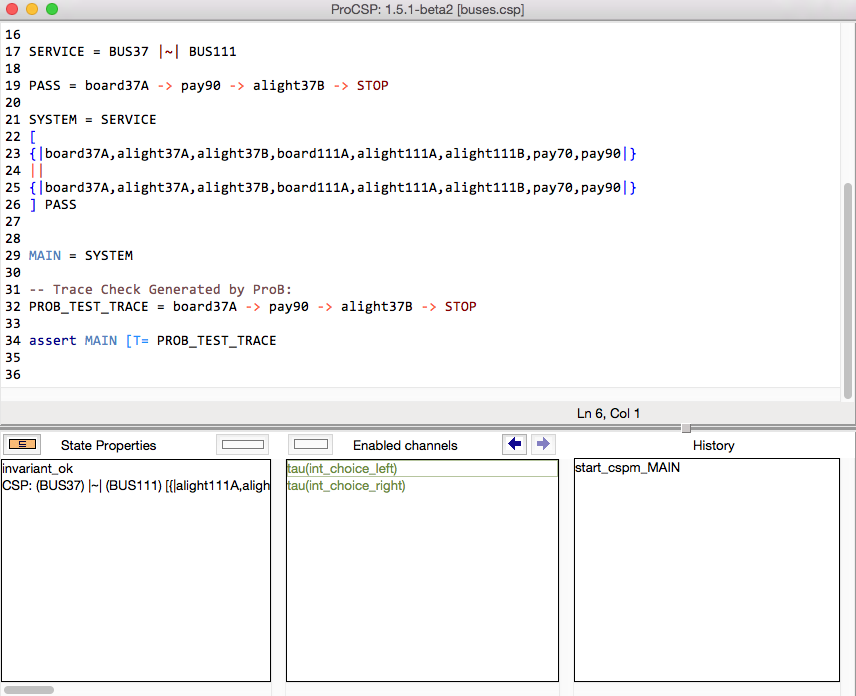
In the "Enabled Operations" pane we can see that two tau events are offered: tau(int_choice_left) and tau(int_choice_right). The "History" pane shows us that we have started the "MAIN" process to reach the current state.
By single-clicking on an event, we can see which parts of the CSP specification contributed to the event. For example, single clicking on the first tau event yields in the following picture:
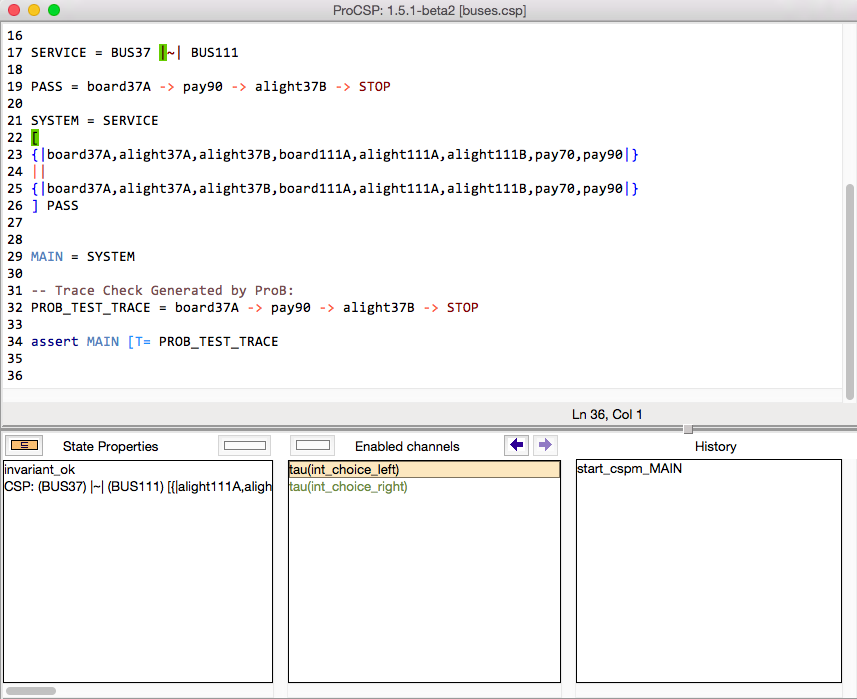
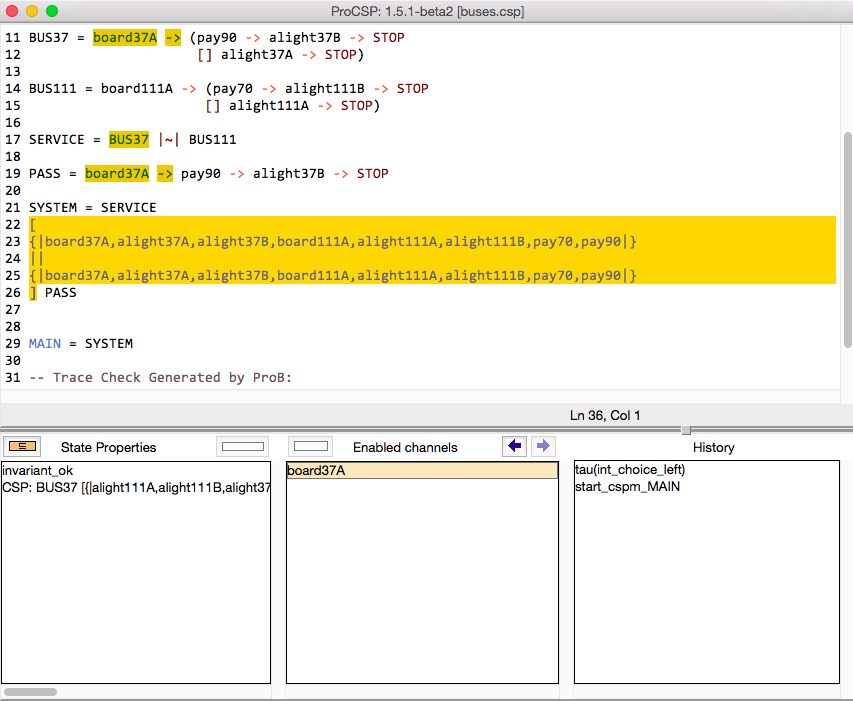
By repeatedly single clicking on the event you can cycle through the various locations that contributed to the event. To execute an event, simply double-click on it. Try this out for yourself: double-click on tau(int_choice_left) and then single-click on the board37 event which is offered. This time the event is a synchronization of two events(note that ProB uses a different colour for highlighting the source locations). The source highlighting should look as follows:
First Steps in Model Checking
You can use the model checker to search for certain errors. Execute the "Model Check..." command in the "Verify Menu". The following dialog box will appear:
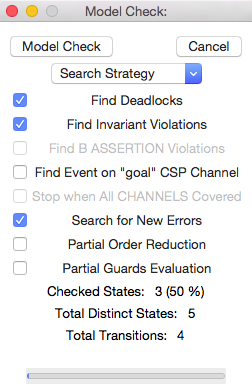
By default, ProB will search for deadlocks, illegal channel values and events on the "error" channel. To turn the latter off, uncheck the "Find Invariant Violation" check box. You can also search for events on the "goal"channel, by checking the corresponding check box ("Find event on goal CSP channel").
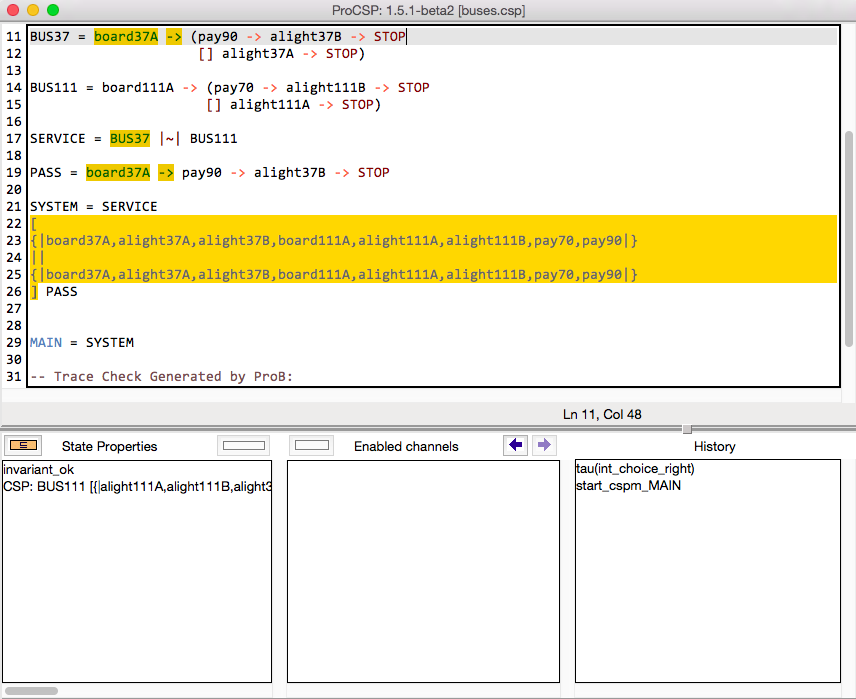
Now press the "Model Check" button. ProB should find a deadlock and insert the counter-example into the history as follows:
Error Highlighting
Now edit the definition of the BUS37 process and add an illegal output of value 1 on the alight37B channel:
  BUS37 = board37A -> (pay90 -> alight37B!1 -> STOP
                    [] alight37A -> STOP)
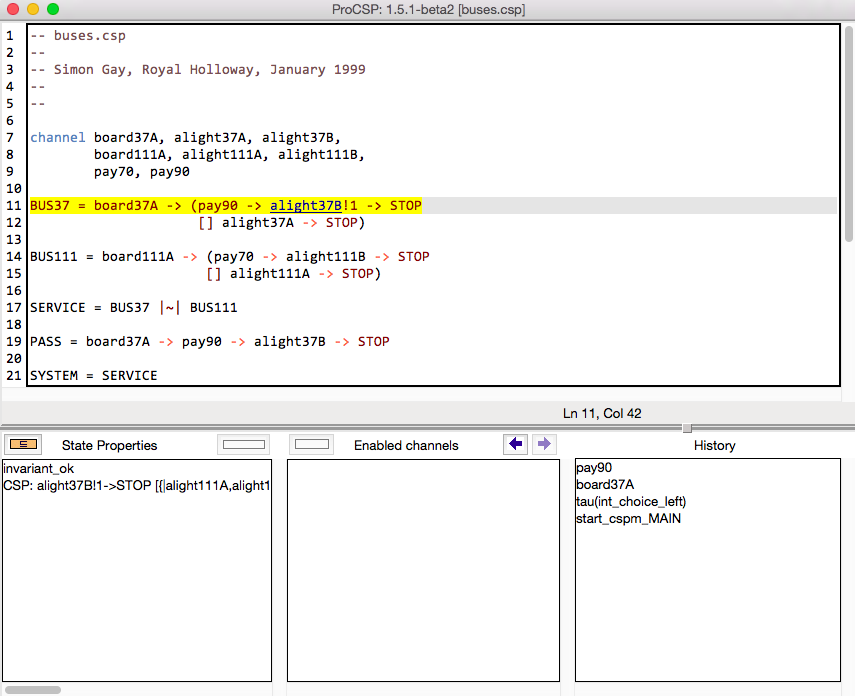
Now save and reload the specification and again choose the "Model Check..." command in the Verify menu. Now uncheck the "Find Deadlocks" check-box and press "Model Check". ProB will report the following error:
 Mismatch in number of arguments for channel synchronisation:
 Channel:ExtraArgs = alight37B:[int(1)]
  ### Line: 11, Column: 30
display the trace to the error in the History pane and highlight the error location in the source as follows:
Other Features
You can check more sophisticated temporal properties using the LTL model checker of ProB; see the corresponding part of the tutorial. For example, you can try and validate the following LTL formula G([board37A] => F [alight37B]). ProB should respond: Formula TRUE. No counterexample found. Similarly, you can check the absence of divergence by checking the LTL formula G not G [tau]. It is also possible to perform trace refinement checks (see Refinement_Checking). The state space visualization features of ProB are also available for CSP; see the corresponding part of the tutorial. For example, if you select the command "Statespace" in the "Visualize" menu (after having fully explored the system), the following graph will be displayed:
