Graphical Viewer: Difference between revisions
No edit summary |
|||
| Line 22: | Line 22: | ||
Note: you can use the "Pick" button to locate the dot program and the dot viewer. | Note: you can use the "Pick" button to locate the dot program and the dot viewer. | ||
[[File:GraphicalViewerPreferences.png]] | [[File:GraphicalViewerPreferences.png]] | ||
In case you want to use the Postscript option, also make sure that you have a viewer for Postscript files installed, and set the | In case you want to use the Postscript option, also make sure that you have a viewer for Postscript files installed, and set the preference "Path/Command for Postscript viewer". | ||
* You can select which viewer to use by going to the "Graphical Viewer" submenu of the "Preferences" Menu: | * You can select which viewer to use by going to the "Graphical Viewer" submenu of the "Preferences" Menu: | ||
[[File:GraphicalViewerSubMenu.png]]. | [[File:GraphicalViewerSubMenu.png]]. | ||
Revision as of 12:50, 18 January 2010
Introduction
ProB can generate a wide range of visualizations for your models. For this ProB generates first a textual representation of a graph in the "dot" format. This information is typically saved to a file which has the same name and path as your main model, but has a ".dot" extension. It then uses GraphViz to render this file. For this it can either make use of the "dot" program to generate a Postscript file (generating a file with the ".ps" extension), or it uses a Dot-Viewer (such as "dotty") to view the file directly.
Setting up the Graphical Viewer
- GraphViz: in order to make use of the graphical visualisation features, you need to install a version of GraphViz suitable for your architecture. More details can be found in Installation.
- Then use the command "Graphical Viewer Preferences..." in the "Preferences" Menu:
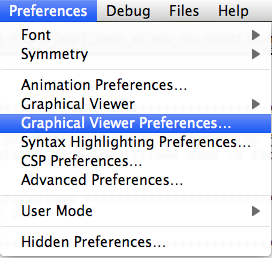

Then set or check the following preferences:
- Path/Command for dot program
- Path/Command for dot viewer (e.g., dotty)
Note: you can use the "Pick" button to locate the dot program and the dot viewer.
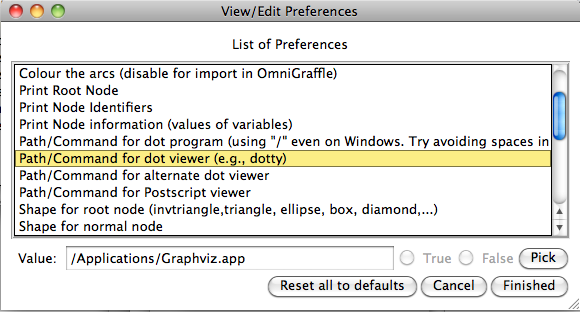

In case you want to use the Postscript option, also make sure that you have a viewer for Postscript files installed, and set the preference "Path/Command for Postscript viewer".
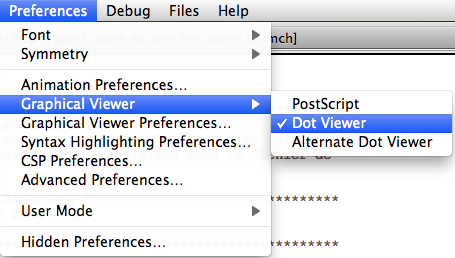
- You can select which viewer to use by going to the "Graphical Viewer" submenu of the "Preferences" Menu:
 .
.
