Bridges Puzzle (Hashiwokakero): Difference between revisions
No edit summary |
|||
| (3 intermediate revisions by the same user not shown) | |||
| Line 44: | Line 44: | ||
p1i == prj1(nodes,INTEGER) | p1i == prj1(nodes,INTEGER) | ||
SETS | SETS | ||
N = {a,b,c,d,e,f,g,h,i,j,k,l,m,n} | N = {a,b,c,d,e,f,g,h,i,j,k,l,m,n} | ||
CONSTANTS nodes, ignore, nl, xc,yc, plx,ply,pl, cs, sol, connected | CONSTANTS nodes, ignore, nl, xc,yc, plx,ply,pl, cs, sol, connected | ||
| Line 128: | Line 127: | ||
== Adding graphical visualization == | == Adding graphical visualization == | ||
To show the solution graphically, we can add the following to the <tt>DEFINITIONS</tt> clause in the model: | To show the solution graphically, we can add the following [[Custom_Graph|custom graph]] to the <tt>DEFINITIONS</tt> clause in the model: | ||
<pre> | <pre> | ||
CUSTOM_GRAPH_NODES == {n,w,w2|(n|->w):nl & w=w2}; // %n1.(n1:nodes|nl(n1)); | CUSTOM_GRAPH_NODES == {n,w,w2|(n|->w):nl & w=w2}; // %n1.(n1:nodes|nl(n1)); | ||
| Line 134: | Line 133: | ||
</pre> | </pre> | ||
One can then load the model, perform the initialisation (double clicking on < | One can then load the model, perform the initialisation (double clicking on <tt>INITIALISATION</tt> in the operations pane) and the execute the command "Current State as Custom Graph" in the States sub-menu of the Visualize menu. This leads to the following picture: | ||
[[File:ProB_BridgesSol.png|400px|center]] | [[File:ProB_BridgesSol.png|400px|center]] | ||
Latest revision as of 16:50, 6 January 2024
The Hashiwokakero Puzzle is a logical puzzle where one has to build bridges between islands. The puzzle is also known under the name Ai-Ki-Ai. The puzzles can also be played online.
The requirements for this puzzle are as follows:
- the goal is to build bridges between islands so as to generate a connected graph
- every island has a number on it, indicating exactly how many bridges should be linked with the island
- there is an upper bound (MAXBRIDGES) on the number of bridges that can be built-between two islands
- bridges cannot cross each other
A B model for this puzzle can be found below. The constants and sets of the model are as follows:
- N are the nodes (islands); we have added a constant ignore where one can stipulate which islands should be ignored in this puzzle
- nl (number of links) stipulates for each island how many bridges it should be linked with
- xc, yc are the x- and y-coordinates for every island
A simple puzzle with four islands would be defined as follows, assuming the basic set N is defined as N = {a,b,c,d,e,f,g,h,i,j,k,l,m,n}:
 xc(a)=0 & xc(b)=1 & xc(c)=0 & xc(d) = 1 &
 yc(a)=0 & yc(b)=0 & yc(c)=1 & yc(d) = 1 &
 nl = {a|->2, b|->2, c|->2, d|->2} &
 ignore = {e,f,g,h,i,j,k,l,m,n}
Below we will use a more complicated puzzle to illustrate the B model.
The model then contains the following derived constants:
- plx,ply: the possible links between islands on the x- and y-axis respectively
- pl: the possible links both on the x- and y-axis combined
- cs: the conflict set of links which overlap, i.e., one cannot build bridges on both links (a,b) when the pair (a,b) is in cs
- connected: the set of links on which at least one bridge was built
The model also sets up the goal constant sol which maps every link in pl to a number indicating how many bridges are built on it. The model also stipulates that the graph set up by connected generates a fully connected graph.
Here is the full model:
MACHINE Bridges
DEFINITIONS
 MAXBRIDGES==2;
 LINKS == 1..(MAXBRIDGES*4);
 COORD == 0..10;
 p1 == prj1(nodes,nodes);
 p2 == prj2(nodes,nodes);
 p1i == prj1(nodes,INTEGER)
SETS
 N = {a,b,c,d,e,f,g,h,i,j,k,l,m,n}
CONSTANTS nodes, ignore, nl, xc,yc, plx,ply,pl, cs, sol, connected
PROPERTIES
 nodes = N \ ignore &
 // target number of links per node:
 nl : nodes --> LINKS & /* number of links */

// coordinates of nodes
 xc: nodes --> COORD & yc: nodes --> COORD &

// possible links:
 pl : nodes <-> nodes &
 plx : nodes <-> nodes &
 ply : nodes <-> nodes &

 plx = {n1,n2 | xc(n1)=xc(n2) & n1 /= n2 & yc(n2)>yc(n1) &
        !n3.(xc(n3)=xc(n1) => yc(n3) /: yc(n1)+1..yc(n2)-1) } &
 ply =  {n1,n2 | yc(n1)=yc(n2) & n1 /= n2 & xc(n2)>xc(n1) &
        !n3.(yc(n3)=yc(n1) => xc(n3) /: xc(n1)+1..xc(n2)-1)} &
 pl = plx \/ ply

&
// compute conflict set (assumes xc,yc coordinates ordered in plx,ply)
cs = {pl1,pl2 | pl1:plx & pl2:ply &
                xc(p1(pl1)): xc(p1(pl2))+1..xc(p2(pl2))-1 &
                yc(p1(pl2)): yc(p1(pl1))+1..yc(p2(pl1))-1}
&

sol : pl --> 0..MAXBRIDGES &
!nn.(nn:nodes => SIGMA(l).(l:pl &
   (p1(l)=nn or p2(l)=nn)|sol(l))=nl(nn)) &

!(pl1,pl2).( (pl1,pl2):cs => sol(pl1)=0 or sol(pl2)=0) // no conflicts
&

 // check graph connected
 connected = {pl|sol(pl)>0} &
 closure1(connected \/ connected~)[{a}] = {nn|nn:nodes & nl(nn)>0}


 // encoding of puzzle
&

// A puzzle from bridges.png

 xc(a)=1 & yc(a)=1 & nl(a)=4 &
 xc(b)=1 & yc(b)=4 & nl(b)=6 &
 xc(c)=1 & yc(c)=6 & nl(c)=3 &

 xc(d)=2 & yc(d)=2 & nl(d)=1 &
 xc(e)=2 & yc(e)=5 & nl(e)=2 &

 xc(f)=3 & yc(f)=2 & nl(f)=4 &
 xc(g)=3 & yc(g)=4 & nl(g)=6 &
 xc(h)=3 & yc(h)=5 & nl(h)=4 &

 xc(i)=4 & yc(i)=3 & nl(i)=3 &
 xc(j)=4 & yc(j)=6 & nl(j)=3 &

 xc(k)=5 & yc(k)=2 & nl(k)=1 &

 xc(l)=6 & yc(l)=1 & nl(l)=4 &
 xc(m)=6 & yc(m)=3 & nl(m)=5 &
 xc(n)=6 & yc(n)=5 & nl(n)=2 &
 ignore = {}

END
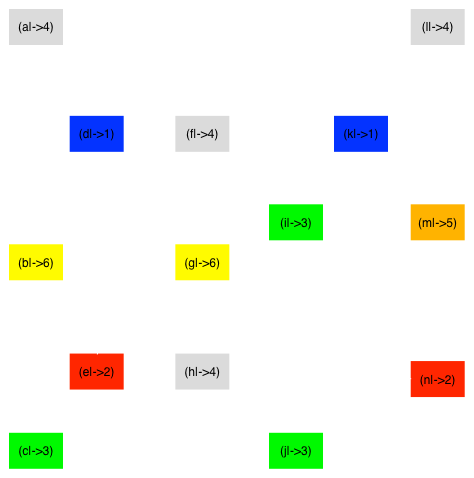
The puzzle encode above can be visualized as follows:

A solution for this puzzle is found by ProB in 0.08 seconds (on a MacBook Air 2.2GHz i7). The conflict set is {((d|->e),(b|->g)), ((i|->j),(h|->n))} and the value for sol is
{((a|->b)|->2),((a|->l)|->2),((b|->c)|->2),((b|->g)|->2),((c|->j)|->1),
 ((d|->e)|->0),((d|->f)|->1),((e|->h)|->2),((f|->g)|->2),((f|->k)|->1),
 ((g|->h)|->2),((h|->n)|->0),((i|->j)|->2),((i|->m)|->1),((l|->m)|->2),((m|->n)|->2)}
Adding graphical visualization
To show the solution graphically, we can add the following custom graph to the DEFINITIONS clause in the model:
 CUSTOM_GRAPH_NODES == {n,w,w2|(n|->w):nl & w=w2}; // %n1.(n1:nodes|nl(n1));
 CUSTOM_GRAPH_EDGES == {n1,w,n2|n1:nl & n2:nl &  (p1i(n1),p1i(n2),w):sol}
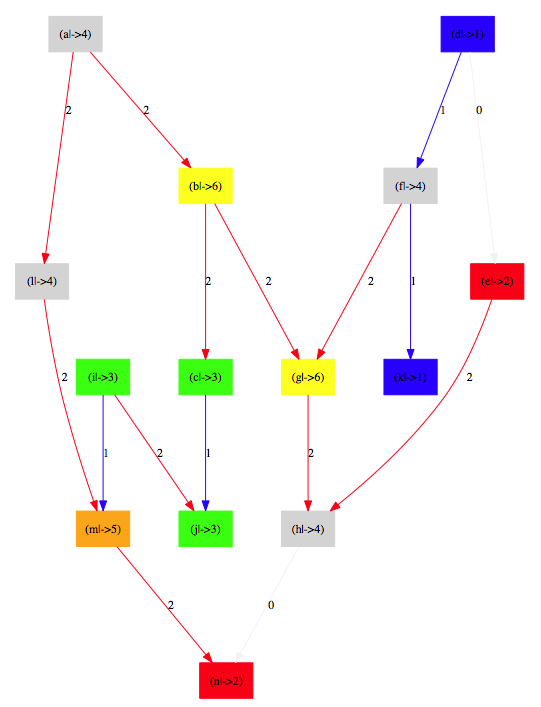
One can then load the model, perform the initialisation (double clicking on INITIALISATION in the operations pane) and the execute the command "Current State as Custom Graph" in the States sub-menu of the Visualize menu. This leads to the following picture:

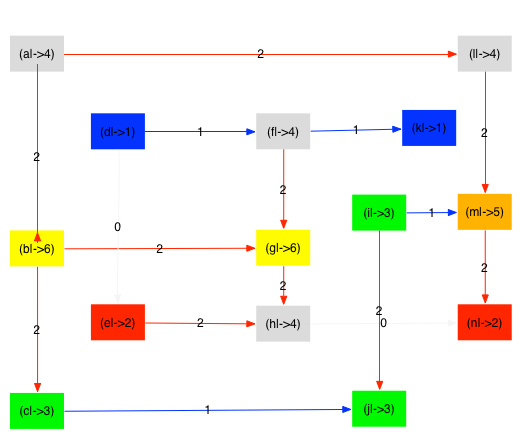
One can load the Dot file generated by ProB into another tool (e.g., OmniGraffle) and then re-arrange the nodes to obtain the rectangular layout respecting the x- and y-coordinates:
